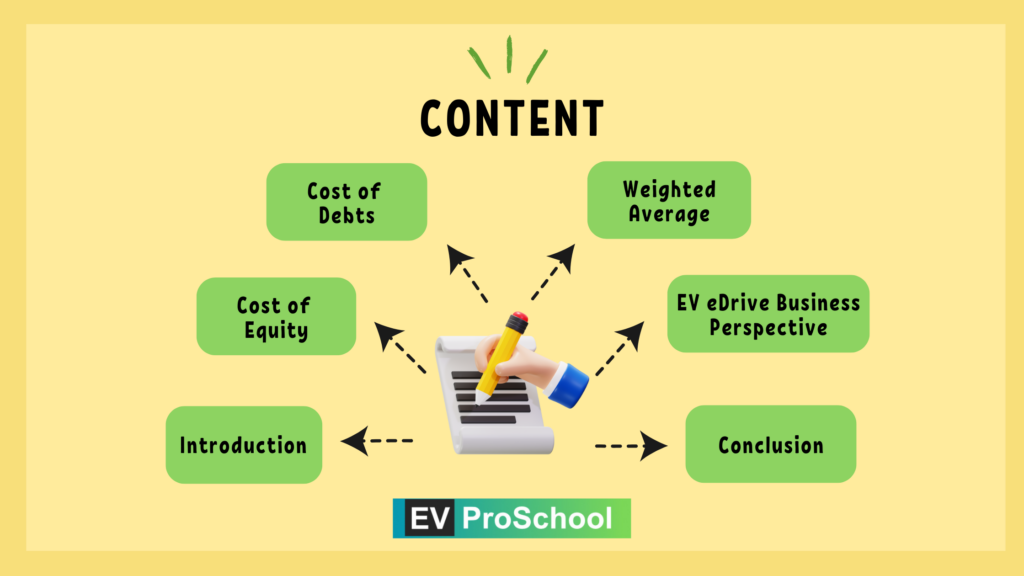
In the electric vehicle (EV) industry, understanding the cost of equity is crucial for businesses navigating the complex landscape of financing and investment. This cost reflects the return that equity investors expect on their investment in the company. A key method to estimate the cost of equity is the Dividend Valuation Method (DVM), which we’ll explore through a theoretical formula and an example from the EV sector.

Understanding the Cost of Equity
The cost of equity represents the compensation that investors require for bearing the risk associated with holding a company’s equity. It is a critical component in determining a company’s Weighted Average Cost of Capital (WACC) and influences decisions on funding, investment, and growth strategies. For EV companies, which often face high capital expenditure and rapid technological advancements, accurately estimating the cost of equity is essential for attracting and retaining investors.
Dividend Valuation Method (DVM)
The DVM calculates the cost of equity based on the dividends a company is expected to pay out to its shareholders, adjusted for growth. The theoretical formula for DVM is:

The cost of equity calculation, especially within the context of the Dividend Valuation Model (DVM), uses the “Current Market Value” or “Ex-Dividend Price” in the denominator for several fundamental reasons. This approach aims to reflect the most accurate cost to an investor of buying a share at that moment, excluding the value of the dividend just paid. Let’s delve into why this is significant and illustrate it with an example.
There are two important things to understand further. (A) Current market Value (also know as Ex-Dividend Price) & (B) Growth Rate
Understanding Role of Current Market Value
Reflection of Current Investment Cost:
The cost of equity represents the return that investors require to compensate them for the risk of investing in the company. Since investors purchase shares at the market price, it’s this price that reflects the current cost of investing. Using the market value in the denominator ensures that the calculation is grounded in the real-world scenario of what an investor would actually pay to acquire the stock.
Ex-Dividend Price Adjustment:
When a stock goes ex-dividend, its price typically drops by approximately the amount of the dividend. This reduction reflects that new buyers won’t receive the most recently declared dividend. Incorporating the ex-dividend price (which is essentially the market price adjusted for the dividend payout) ensures that the calculation considers this adjustment, offering a clearer picture of the investment’s return excluding the immediate dividend benefit.
Theoretical Example: “ElectroMotive Drives”
Consider “ElectroMotive Drives,” a hypothetical company in the EV sector focusing on developing advanced eDrive systems. Suppose ElectroMotive is expected to pay a dividend of INR 5 per share next year, and its current market value per share is INR 100. If the expected growth rate of dividends is 6%, we can calculate the cost of equity as follows:

Implications for “ElectroMotive Drives”
An 11% cost of equity implies that “ElectroMotive Drives” must generate returns of at least 11% on the equity financed projects to satisfy its equity investors’ return expectations. For an EV company like ElectroMotive, this figure is crucial for evaluating whether investing in new eDrive technologies or expanding manufacturing capabilities will meet the required return thresholds.
Dividend Growth Rate
The dividend growth rate is a crucial metric for investors, especially when analyzing companies in sectors like electric vehicles (EV), where growth prospects can significantly influence investment decisions. The dividend growth rate can be calculated using different methods, each with its unique approach and implications. Here, we discuss the two primary methods: the Averaging Method and the Growth Rate based upon Profit Retention Rate.

1. Averaging Method
The Averaging Method involves calculating the average percentage growth in dividends over a specific period. This method is straightforward and is particularly useful for investors looking to gauge the historical growth rate of a company’s dividends.
Do you know: Preference Share Meaning EV Sector: Now Balancing Growth with Return
How to Calculate:
- Identify the dividends paid over the period you want to analyze.
- Calculate the year-over-year growth rates for dividends.
- Average these annual growth rates.
Example in the EV Sector:
Consider a hypothetical EV company, “FutureDrive,” that has paid dividends as follows over five years:
- Year 1: INR 2.00
- Year 2: INR 2.10
- Year 3: INR 2.30
- Year 4: INR 2.50
- Year 5: INR 2.75
To calculate the average annual growth rate:
- Growth from Year 1 to Year 2: 5%
- Growth from Year 2 to Year 3: 9.52%
- Growth from Year 3 to Year 4: 8.7%
- Growth from Year 4 to Year 5: 10%
Average growth rate = (5% + 9.52% + 8.7% + 10%) / 4 = 8.3%
2. Growth Rate Based Upon Profit Retention Rate
This method links the dividend growth rate to the company’s retained earnings and the return on equity (ROE). It assumes that the portion of earnings not paid out as dividends is reinvested in the business, contributing to future growth.
How to Calculate:
- Determine the retention ratio (b), which is the proportion of earnings retained (not paid out as dividends).
- Identify the company’s return on equity (ROE).
- The growth rate (g) is then estimated as: (g = b \times ROE)
Example in the EV Sector:
Let’s say “FutureDrive” has an ROE of 15% and pays out 60% of its earnings as dividends, retaining 40% of its earnings.
- Retention ratio (b) = 40% or 0.4
- ROE = 15%
Growth rate (g) = 0.4 × 15% = 6%
In practice, an investor might use both methods to gain a comprehensive view of a company’s dividend growth potential, combining historical performance with strategic reinvestment prospects.
Conclusion
The cost of equity is a pivotal factor in the financial strategy of EV companies. By employing the Dividend Valuation Model, companies can estimate the returns required to attract equity investment. However, it’s important to note that DVM has limitations, including its reliance on dividends, which not all companies pay, and the assumption of constant growth rates.
For EV businesses, which are at the forefront of technological innovation and market expansion, understanding and communicating the cost of equity effectively can play a significant role in securing the necessary capital to fuel growth and deliver value to shareholders.


